

July 8, 2026
Economic Conditions Surrounding Xenophobic Violence in South Africa and Historical Migrant Expulsions in Africa: A Descriptive Analysis, 1965 to 2026
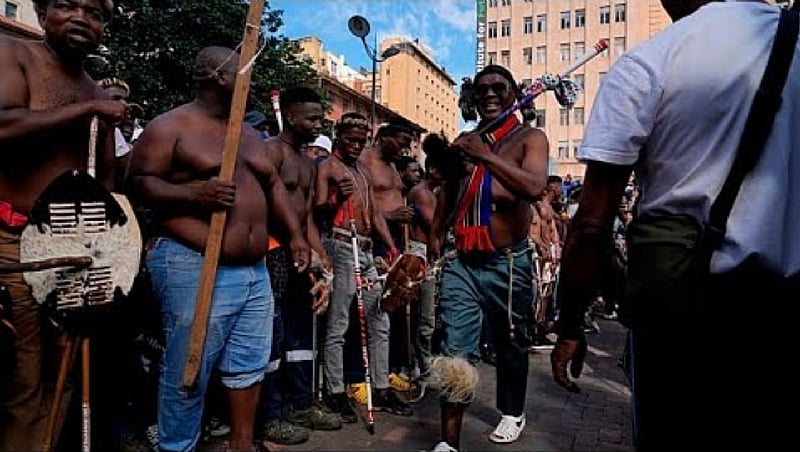


Economic Conditions Surrounding Xenophobic Violence in South Africa and Historical Migrant Expulsions in Africa: A Descriptive Analysis, 1965 to 2026
Migration, Governance, and Development Desk

Abstract
This paper asks a simple question: when African countries have turned against foreign nationals through mob violence, government expulsion orders, or both, did the economic conditions that were supposedly the point of the exercise improve afterward? Using World Bank indicators for unemployment, inflation, GDP growth, and government debt, the study traces South Africa’s economic trajectory from 1991 to 2026 against its five major waves of xenophobic violence: May 2008, April 2015, September 2019, the 2021 – 2022 rise of Operation Dudula, and the 2026 “March and March” campaign. It then revisits three historical expulsion episodes elsewhere on the continent: Ghana’s 1969 Aliens Compliance Order, Nigeria’s 1983 and 1985 expulsions of West African migrants, and Idi Amin’s 1972 expulsion of Asians from Uganda using some economic indicators data available for each period.
The analysis is deliberately descriptive rather than causal. It does not argue that economic hardship causes xenophobic violence, nor that these events caused whatever followed them. It asks only what the record shows before and after. In every case examined, some form of economic strain, rising unemployment, an inflation shock, a currency or commodity crisis, or mounting public debt was already visible in the years leading up to the incident. In no case did the years that followed show a durable improvement in these indicators that could reasonably be credited to the removal or exclusion of foreign nationals. Conditions either stayed on the same trajectory or worsened. The paper offers these findings as a starting point rather than a verdict, and closes with recommendations for the more rigorous, country-specific research this topic deserves.
Introduction
Xenophobic violence in South Africa is not a single event but a recurring one. Since the nationwide attacks of May 2008, which left more than 60 people dead and displaced roughly one hundred thousand more, the country has cycled through further outbreaks in 2015, 2019, 2021 – 2022, and again in the first half of 2026. Each wave has arrived carrying a similar justification: that foreign nationals are taking jobs, straining public services, and driving crime that would otherwise not exist. Politicians, vigilante movements, and ordinary frustrated citizens have repeated versions of this claim for close to two decades, even as independent researchers have repeatedly found little evidence to support it.
South Africa is not unusual in this respect, only well documented. Other African countries have gone further than street violence and used the machinery of the state itself to expel foreign populations outright, usually with the explicit promise that doing so would free up jobs, businesses, and opportunities for citizens. Ghana’s 1969 Aliens Compliance Order pushed out well over a hundred thousand migrants, most of them Nigerian. Nigeria returned the favor in 1983 and again in 1985, expelling an estimated one 1 – 2 million West African migrants, many of them Ghanaian, in what became known as the “Ghana Must Go” episode. Uganda’s Idi Amin expelled the country’s entire Asian population in 1972, seizing their businesses and redistributing them to his allies. Each of these episodes was framed, at the time, as an act of economic self-defense.
This paper treats that framing as a testable claim rather than a settled fact. If expulsions and xenophobic campaigns genuinely free up economic space for citizens, that should be visible in the data that follow them: falling unemployment, easing inflation, stronger growth, healthier public finances and other indicators. If these episodes are a symptom of economic distress rather than a cure for it, the indicators should tell a different story, one of hardship before the event and continuing or worsening hardship after it, regardless of how many foreign nationals were removed. The purpose of this study is to lay that record out plainly, country by country and incident by incident, using the economic data available, and to let the pattern speak for itself.
Literature Review
The academic and advocacy literature on this subject is substantial, though this paper does not attempt to summarize it exhaustively. South African researchers, notably at the University of the Witwatersrand’s Xenowatch project, have tracked xenophobic incidents since the 1990s and documented a death toll running into the hundreds. Scholars such as Michael Neocosmos have argued that post-apartheid xenophobia is rooted less in economic competition itself than in unresolved questions of who counts as a legitimate citizen. Fact-checking organizations, including Africa Check, have repeatedly tested and rejected the specific claim that undocumented migrants are responsible for South Africa’s crime rates or its weak economic performance.
On the historical expulsions, the record is thinner and more fragmented. Ghana’s Aliens Compliance Order has been studied mainly through historical and political accounts rather than systematic economic analysis and estimates of how many people were expelled vary considerably across sources. Nigeria’s 1983 and 1985 expulsions are well documented as political and social events but are rarely examined against a full macroeconomic time series. Uganda’s 1972 expulsion is the most frequently cited of the four cases in economic terms, largely because the collapse that followed was so steep and so widely reported. This paper does not attempt to close these gaps in the literature. It simply lines up the economic data that exist for each case and asks what they show.
Methodology
This study draws on two categories of information. The first is quantitative: World Bank indicators for South Africa (unemployment rate, consumer price inflation, annual GDP growth, and government gross debt as a share of GDP, 1991- 2025), Ghana (GDP growth and inflation, 1965 – 1976), and Nigeria (GDP growth and inflation, 1979 – 1990), all supplied for this analysis. Limited comparable time series was available for Uganda, so the 1972 Ugandan case is treated qualitatively, drawing on secondary historical reporting rather than a constructed dataset.
The second category is qualitative: the dating and description of each xenophobic incident and expulsion, drawn from Human Rights Watch, United Nations human rights experts, the African Commission on Human and Peoples’ Rights, Al Jazeera, NPR, and the compiled historical timeline maintained on Wikipedia, cross-checked against academic and journalistic accounts of the Ghanaian, Nigerian, and Ugandan episodes.
For South Africa, each incident year was compared against a three-year average of each indicator in the years immediately before and immediately after, where data permitted. For the 2026 episode, only the pre-incident average could be calculated, since the year is not yet complete at the time of writing. For Ghana and Nigeria, similar before-and-after windows were used around the 1969 and 1983/1985 events respectively. This is a descriptive, trend-based approach that identifies patterns and coincidences in the data but does not attempt to isolate the causal effect of any single event through regression or statistical testing. Where a plausible alternative explanation for a data pattern exists (a global oil shock, a pandemic, a change in government), it is noted rather than ignored.
Limitations of this approach including small sample size, the influence of confounding global and domestic events, and inconsistencies in how source material defines and counts affected populations are disclosed in full later in this paper.
Results and Findings
South Africa: The Long View, 1991 – 2025
Look at South Africa’s economic indicators across the past three and a half decades and one thing stands out immediately: the unemployment rate has never dipped below 22% since the early 1990s, and for the past ten years it has done nothing but climb. It sat at 22.5% in 1996 and reached 32.4% by 2025, with the Human Rights Watch report on the 2026 unrest citing a broader measure above 43% when discouraged work-seekers are included. Inflation, by contrast, has generally trended downward and stayed within a manageable band since the early 2000s, aside from isolated shocks in 2002 and 2008. Government debt tells its own story: after falling to a low of 24% of GDP in the late 2000s, it has risen almost every year since the 2008 financial crisis, crossing 78% of GDP by 2025 nearly triple where it stood twenty years earlier.
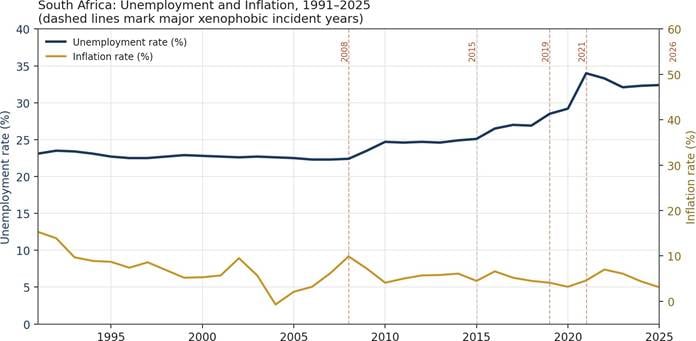
Figure 1. South Africa unemployment and inflation, 1991–2025. Dashed lines mark the five xenophobic incident years discussed in this paper. Source: World Bank data supplied for this study.
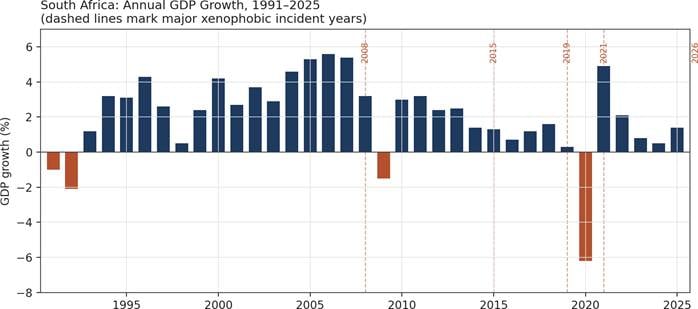
Figure 2. South Africa annual GDP growth, 1991–2025. Source: World Bank data supplied for this study.
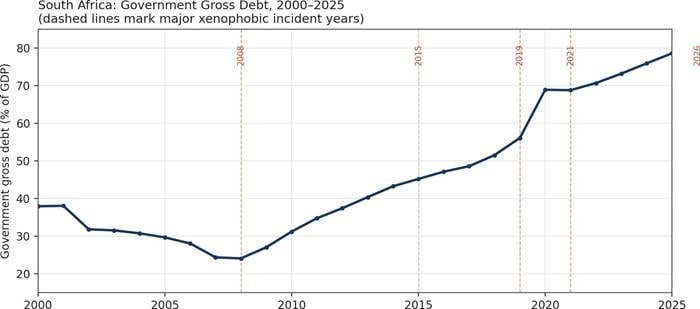
Figure 3. South Africa government gross debt as a percentage of GDP, 2000–2025. Source: World Bank data supplied for this study.
Against that backdrop, each of the five major incidents examined here occurred at a moment when at least one of these pressures was already elevated or worsening.
May 2008 : Nationwide Attacks Beginning in Alexandra
The 2008 violence began in Alexandra township and spread to more than a hundred locations nationwide, killing at least 62 people 21 South Africans and dozens of Mozambican, Zimbabwean, and Somali nationals among them and displacing about 100,000. It arrived in the middle of a global food and fuel price shock: South African inflation jumped from 6.2% in 2007 to 9.9% in 2008, the sharpest one-year increase in the entire series outside 2002. GDP growth had already been decelerating for two years, down from 5.6% in 2006 to 3.2% in 2008, as the early tremors of the global financial crisis reached South African shores.
What followed was not relief but the country’s first recession of the democratic era. GDP contracted by 1.5% in 2009. Unemployment, which stood at 22.4% in 2008, averaged 24.3% over the following three years.
Government debt, at a comfortable 24% of GDP in 2008, climbed to approximately 35% by 2011 as the state borrowed to cushion the downturn. Whatever the attacks were meant to achieve for South African job seekers, the years that followed delivered the opposite of what was promised.
April 2015 : Durban and the Nationwide Spread
The second major wave, in April 2015, followed remarks attributed to the Zulu monarch that were widely interpreted as an instruction for foreigners to leave. Violence spread from Durban to Johannesburg and elsewhere, killing at least 7 people and prompting the deployment of the military to restore order. Unlike 2008, this episode was not preceded by an inflation spike, price growth was a moderate 4.5%, but it did follow three years in which GDP growth had slowed from 2.5% to 1.3% and unemployment had crept up from 24.6 to 25.1%.
Three years after 2015 brought no turnaround. Unemployment rose further, averaging 26.8% between 2016 and 2018. GDP growth stayed weak, averaging just 1.2% over the same period. Government debt rose from just over 40% of GDP to 49%. The pattern from 2008 repeated itself: a period of gradually building pressure, an outbreak of violence, and a continuation not a reversal of the underlying trend.
September 2019 : Attacks on Foreign-Owned Businesses in Johannesburg
By September 2019, when mobs targeted foreign-owned shops around Johannesburg and killed at least 12 people, unemployment had reached 28.5%, the highest level in the series to that point, and GDP growth had all but stalled at 0.3%. Government debt had already climbed past 56% of GDP. Within six months of the attacks, the COVID-19 pandemic arrived, and whatever independent effect the 2019 violence might have had on the economy was overtaken by a shock of a different order entirely: GDP contracted by 6.2% in 2020, the deepest contraction anywhere in our dataset, and debt leapt to nearly 69% of GDP by the end of that year.
This case illustrates a recurring difficulty in reading this kind of data: the pandemic makes it impossible to isolate what the 2019 unrest alone might have contributed to what followed. What can be said is that the specific outcome the attacks were meant to produce relief for South African job seekers did not materialize in the data available, before or after the pandemic arrived to compound the country’s difficulties.
2021 – 2022 : The Rise of Operation Dudula
Operation Dudula formalized in Soweto in June 2021, growing out of an earlier online movement, and became the most organized vigilante network South Africa had yet produced, patrolling townships, demanding proof of citizenship from traders, and later registering as a political party. Its rise came in the immediate aftermath of the COVID-19 collapse and the July 2021 unrest and mass looting that followed
former president Jacob Zuma’s imprisonment, in which more than 300 people died. Unemployment reached 34% in 2021, its highest level in the series, and government debt crossed 68% of GDP.
GDP growth did rebound to 4.9% in 2021, and on its face, this looks like an improvement. It is worth being direct about why that rebound occurred: it is a base effect, a statistical consequence of bouncing back from the 6.2% collapse of the previous year, not evidence of a newly healthy economy. Government debt and unemployment are the two indicators most directly tied to the frustrations Operation Dudula claimed to be addressing: unemployment eased slightly post-2021 but stayed structurally high while debt kept rising through 2022 and 2023 regardless. The headline growth number recovered; the conditions driving the movement did not.
April – June 2026 : The “March and March” Campaign
The most recent and, by several accounts, most sustained wave of xenophobic mobilization began in April 2026 under the banner of March and March, a movement led by a former Durban radio presenter that organized nationwide demonstrations and set a June 30 deadline for undocumented migrants to leave the country. Human Rights Watch, the African Commission on Human and Peoples’ Rights, the United Nations Secretary-General, and multiple news organizations documented a wave of violence stretching from Pretoria and Johannesburg to Durban, including the killing of at least 5 Ethiopian nationals in Johannesburg in early May, reported deaths among Mozambican nationals under investigation, and the death in police custody of a Malawian national. South Africa’s foreign ministry disputed that some of the Johannesburg deaths were xenophobic in nature, attributing them instead to organized crime, a reminder that even the classification of these events is often contested in real time. Thousands of Malawians, Zimbabweans, and other nationals fled the country or camped outside their consulates awaiting repatriation flights, and several African governments sent aircraft to bring their citizens home.
The economic backdrop to this episode is the most strained of any examined in this paper. Unemployment entering 2026 stood at roughly 32% on the narrower official measure and above 43% on the broader measure cited by Human Rights Watch. Government debt reached nearly 79% of GDP in 2025, the highest level in the series, after more than a decade of near-uninterrupted increases. GDP growth has not exceeded 2% in any year since 2018 outside the pandemic-rebound year of both 2021 and 2022. President Cyril Ramaphosa, in public remarks during the unrest, attributed the underlying frustration to inequality, slow growth, and weak service delivery rather than to migration itself, a description that lines up closely with what the macroeconomic data show. Because the year is not yet complete, this paper cannot report what happens to these indicators afterward, and that gap is noted explicitly as a limitation. What can be said is that, as with every prior episode, the 2026 violence arrived after years of deepening economic strain rather than during a period of improvement.
South Africa: Summary Across the Five Incidents
| Incident year | Unemployment: 3-yr pre-avg → at incident → 3-yr post-avg | Inflation: pre-avg → at incident → post-avg | GDP growth: pre-avg → at inciden post-avg |
| 2008 | 22.4% → 22.4% → 24.3% | 3.8% → 9.9% → 5.4% | 5.4% → 3.2% → 1.6% |
| 2015 | 24.7% → 25.1% → 26.8% | 5.9% → 4.5% → 5.4% | 2.1% → 1.3% → 1.2% |
| 2019 | 26.8% → 28.5% → 32.2% | 5.4% → 4.1% → 4.9% | 1.2% → 0.3% → 0.3% |
| 2021–22 | 28.2% → 34.0% → 32.6% | 3.9% → 4.6% → 5.8% | −1.4% → 4.9%* → 1.1% |
| 2026 | 32.3% → n/a (in progress) → n/a | 4.5% → n/a → n/a | 0.9% → n/a → n/a |
*The 2021 GDP figure reflects a statistical rebound from the 2020 pandemic collapse rather than an underlying improvement in economic conditions; see discussion above.
Ghana: The 1969 Aliens Compliance Order
Ghana’s Aliens Compliance Order, announced by Prime Minister Kofi Busia on November 18, 1969, ordered foreign nationals without proper documentation to regularize their status or leave the country within two weeks. Sources differ considerably on how many people were affected, with figures ranging from roughly 140,000 to 200,000 in most accounts and considerably higher figures appearing in a small number of others; Nigerians made up the largest share of those expelled. The order followed a period of real economic strain: GDP growth in the four years before the order averaged just 0.2%, dragged down by an outright contraction of 4.3% in 1966, and government officials at the time pointed to unemployment, a shortage of foreign exchange linked to remittances sent home by migrants, and pressure on the retail and cocoa sectors as justification for the policy.
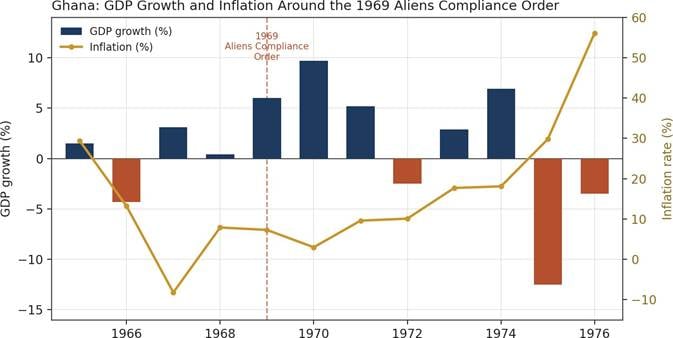
Figure 4. Ghana GDP growth and inflation around the 1969 Aliens Compliance Order. Source: World Bank data supplied for this study.
The immediate aftermath looks, at first glance, like a success story: GDP growth reached 6.0% in 1969 itself and averaged a strong 4.1% across 1970 to 1972. But the order was issued in mid-November, leaving little of 1969’s economic activity to reflect its effects, and the apparent boom did not last. From 1973 to 1976, GDP growth averaged a – 1.6%, including a collapse of 12.5% in 1975 alone among the worst single-year contractions Ghana recorded in the entire postcolonial period. Inflation nearly doubled, from a pre-1969 average of 10.6% to a post-1970 average of 20.6%, before spiraling to 56.1% by 1976. Whatever short-term relief the expulsion order may have provided to specific sectors, it was followed within a few years by one of the deepest economic downturns in Ghana’s history, compounded by global oil price shocks and the loss of the commercial and agricultural labor the expelled migrants had once supplied.
Nigeria: The 1983 and 1985 Expulsions
Nigeria’s expulsion of West African migrants the episode that gave the world the phrase “Ghana Must Go,” after the checkered bags many Ghanaian deportees carried their belongings in took place in two waves, in January 1983 and again in 1985, and is estimated to have affected between 1 – 2 million people, the largest single migrant population being Ghanaian. The policy followed the collapse of global oil prices from roughly
$37 a barrel in 1980 to $29 by 1982, which depleted Nigeria’s foreign reserves by an estimated 90% and pushed GDP growth deeply negative averaging -2.2% across 1979 to 1982, with a contraction of 13.1% in 1981 alone.
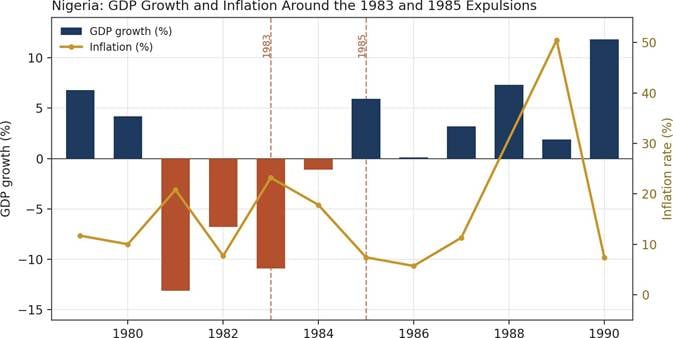
Figure 5. Nigeria GDP growth and inflation around the 1983 and 1985 expulsions. Source: World Bank data supplied for this study.
The year of the first expulsion, 1983, was in fact Nigeria’s worst year of the entire period studied: GDP contracted by 10.9% and inflation ran at 23.2%. The following year, 1984, remained negative. Growth did turn positive by the time of the second expulsion in 1985, at 5.9%, and continued to strengthen through the rest of the decade, averaging 6.1% from 1987 to 1990. It would be a mistake, however, to credit the expulsions for that recovery. Nigeria changed governments twice in this period: a military coup in December 1983 and another in August 1985 and in 1986 launched an IMF-backed Structural Adjustment Programme
that devalued the currency and liberalized trade, changes far more plausibly connected to the growth that followed than the removal of migrant labor. The expulsions coincided with Nigeria’s economic trough and, at best, coincided with its later recovery; they do not appear to have caused either.
Uganda: Idi Amin’s 1972 Expulsion of Asians
Idi Amin’s expulsion of Uganda’s roughly 80,000-strong Asian population in 1972 is the most economically dramatic of the four cases, though it is also the one for which the least systematic time-series data was available for this study. Secondary reporting indicates that Uganda’s economy had been growing at an average of about 4.6% in the years before the expulsion, and that growth turned negative around -0.6% by the following year. The Asian community that Amin expelled had controlled a large share of Uganda’s trade, manufacturing, and tax base; the businesses seized in their absence were redistributed to Amin’s allies and, by most historical accounts, were frequently mismanaged, leading to shortages of basic goods within a matter of months. Uganda’s economy continued to deteriorate for the remainder of the decade under Amin’s rule, a decline compounded by isolation from international lenders and, eventually, war with Tanzania. Because this account relies on a single secondary source rather than a constructed dataset, it is treated here as directional evidence only, and a fuller reconstruction using World Bank or IMF historical series is recommended before drawing firmer conclusions.

Discussion
Line up all four cases and a consistent shape emerges, even though the countries, decades, and forms of hostility differ considerably. South Africa’s 5 xenophobic waves each arrived after a period of rising unemployment, an inflation shock, slowing growth, or mounting public debt, sometimes more than one at once and in every single instance, the 3 years that followed showed the same pressures continuing or intensifying rather than easing. Ghana’s expulsion order was followed by a few years of apparent stability before giving way to one of the country’s steepest economic collapses on record. Nigeria’s expulsions bracketed its worst growth performance of the entire 1979 – 1990 window, and the recovery that eventually came is better explained by an IMF program and two changes of government than by the removal of migrant labor. Uganda’s case, though the thinnest on data, shows the fastest and most severe reversal of the four, with growth flipping from solidly positive to negative within a single year.
None of this supports the claim, made at the time of nearly every one of these events, that removing foreign nationals would free up jobs, businesses, and opportunities for citizens in any way that shows up in the aggregate numbers. This finding lines up with existing South African research Africa Check’s review of the specific claim that undocumented migrants damage the economy found no supporting evidence, and Georgetown’s Journal of International Affairs has noted that studies consistently disprove the idea that foreign nationals are responsible for South Africa’s economic or crime problems while extending the same basic test to three historical cases elsewhere on the continent that are rarely examined in economic terms at all.
It is worth being equally direct about what this pattern does not show. It does not show that expulsions or xenophobic violence caused the downturns that followed them. Global oil shocks, a worldwide financial crisis, a pandemic, and multiple changes of government all occurred at various points in this data and plausibly account for a great deal of what happened independent of any migration policy. It is also possible that these events, and the migrant populations they targeted, were simply too small relative to the size of these national economies to move aggregate indicators like GDP growth in either direction in which case the more accurate reading is not that expulsions caused harm, but that they were economically beside the point, a piece of political theater layered on top of problems with entirely different roots. Reverse causality is also plausible and, on the evidence presented here, probably the stronger reading: economic distress appears to precede these incidents more reliably than these incidents precede economic improvement. What the data support, cautiously, is a narrower and more defensible claim: in every documented case examined in this paper, the specific economic turnaround that expulsion or exclusion was promised to deliver did not appear in the record afterward.
Limitations
● Data limitations: The analysis relies on aggregate national indicators unemployment, inflation, GDP growth, government debt and other secondary sources which can mask sector-specific effects. If expulsions concentrated their impact on retail trade, informal commerce, or agriculture, as several of the historical accounts suggest, those effects may not be visible at the national level even where they were locally significant.
● Sampling limitations: This paper examines four documented cases. It does not cover other
anti-migrant episodes on the continent, including incidents in Zambia, the Democratic Republic of Congo, Libya, or Tunisia, and cannot claim that its findings generalize to every instance of
anti-migrant policy or violence in Africa.
● Geographic limitations: Three of the four cases are West or East African; only one, South Africa, is Southern African. Regional economic structures differ enough that findings from one case should not be assumed to transfer automatically to another.
● Methodological limitations: Before and after comparisons of this kind cannot rule out confounding events occurring at the same time global commodity price shocks, financial crises, pandemics, and domestic political transitions all coincide with one or more of the cases examined here. The three year before/after windows used for South Africa, Ghana, and Nigeria are a reasonable but somewhat arbitrary choice, and a longer or shorter window could shift some of the averages reported. The Uganda case lacks a full constructed time series and relies on a single secondary source. Estimates of how many people were expelled vary considerably across sources for both the Ghanaian and Nigerian cases, and South Africa’s unemployment rate itself is reported differently depending on whether a narrow or expanded definition is used, which affects comparisons across sources cited in this paper. Finally, the 2026 South African episode is not yet complete at the time of writing, so no post-incident comparison is possible for that case.
Recommendations
● Governments considering restrictive migration enforcement as a response to economic pressure should commission independent, sector-level impact assessments before acting. Nothing in the aggregate data reviewed here supports the assumption that removing foreign nationals delivers durable economic improvement, and sector-level analysis would test this more precisely than national indicators alone.
● Regional and continental bodies, including the African Union, SADC, and ECOWAS, should establish a jointly maintained database that pairs documented anti-migrant incidents with standardized economic indicators, allowing future researchers to apply more rigorous methods, such as synthetic control or event-study analysis, than were possible with the data available for this paper.
● South African policymakers should treat the recurring pre-incident indicators identified in this paper rising unemployment, mounting public debt, and stalling growth as the more direct targets for intervention, since these pressures have continued to build across every one of the past five incidents regardless of enforcement action taken against foreign nationals.
|
Note on Interpretation
Consistent with the standard this paper was written to, none of the findings above should be read as proof of any causal relationship. The data indicates, suggests, and shows a pattern of association between economic strain and these events, and between these events and continued rather than improved conditions afterward. They do not confirm or demonstrate causation in either direction, or readers, including policymakers considering similar measures in the future should treat the findings accordingly.
References
African Commission on Human and Peoples’ Rights. (2026, April 27). The African Commission on Human and Peoples’ Rights deplores the xenophobic attacks and vigilante conduct perpetrated on nationals of other African countries in the Republic of South Africa.
https://achpr.au.int/en/news/press-releases/2026-04-27/xenophobic-attacks-and-vigilante-conduct-perpetra ted-nationals-other
Al Jazeera. (2023, September 26). South Africa’s Operation Dudula vigilantes usher in a new wave of xenophobia.
https://www.aljazeera.com/features/2023/9/26/south-africas-operation-dudula-vigilantes-usher-in-new-wav e-of-xenophobia
Al Jazeera. (2026, June 22). South African police tighten security as anti-migrant deadline approaches. https://www.aljazeera.com/news/2026/6/22/south-african-police-tighten-security-as-anti-migrant-deadline-approaches
CNBC Africa. (2026). Xenophobic attacks are hurting South Africa’s image abroad, says minister. https://www.cnbcafrica.com/2026/xenophobic-attacks-are-hurting-south-africas-image-abroad-says-ministe r
Digital Teachers Uganda. (n.d.). How did the 1972 expulsion of Asians affect the social and economic development of Uganda?
https://digitalteachers.co.ug/how-did-the-1972-expulsion-of-asian-affect-the-social-and-economic-develop ment-of-uganda/
Georgetown Journal of International Affairs. (2024, May 26). Xenophobia: A pervasive crisis in post-apartheid South Africa.
https://gjia.georgetown.edu/2024/05/26/xenophobia-a-pervasive-crisis-in-post-apartheid-south-africa/
GhanaRemembers. (2025). Ghana Aliens Compliance Order: A controversial chapter in immigration history. https://ghanaremembers.com/stories/history/ghana-aliens-compliance-order-a-controversial-chapter-in-im migration-history.html
Historical Nigeria. (2026). Ghana Must Go: The 1983 expulsion that forced millions to leave Nigeria. https://historicalnigeria.com/ghana-must-go-the-1983-expulsion-that-forced-millions-to-leave-nigeria/
Human Rights Watch. (2026, May 20). South Africa: New waves of xenophobic attacks. https://www.hrw.org/news/2026/05/20/south-africa-new-waves-of-xenophobic-attacks
NPR. (2026, June 25). ‘They can kill you’: African migrants fear a surge in xenophobic violence in South Africa. https://www.npr.org/2026/06/25/nx-s1-5866241/they-can-kill-you-immigrants-fear-a-surge-in-xenophobic-vi olence-in-south-africa
Origins, Implementation and Effects of Ghana’s 1969 Aliens Compliance Order. (2009). Academia.edu. https://www.academia.edu/43239968/Origins_Implementation_and_Effects_of_Ghanas_1969_Aliens_Com pliance_Order
United Nations News. (2022, July 20). South Africa ‘on the precipice of explosive xenophobic violence’, UN experts warn. https://news.un.org/en/story/2022/07/1122612
Wikipedia. (2026). Deportation of West African migrants from Nigeria. https://en.wikipedia.org/wiki/Deportation_of_West_African_migrants_from_Nigeria
Wikipedia. (2026). Xenophobia in South Africa. https://en.wikipedia.org/wiki/Xenophobia_in_South_Africa
World Bank. World Development Indicators: Unemployment, inflation (consumer prices), GDP growth (annual %), and government gross debt (% of GDP), South Africa, Ghana, and Nigeria. Dataset supplied for this study.
Disclaimer: “The views expressed in this article are the author’s own and do not necessarily reflect ModernGhana official position. ModernGhana will not be responsible or liable for any inaccurate or incorrect statements in the contributions or columns here.”
Follow our WhatsApp channel for meaningful stories picked for your day.

Top Stories


45 minutes ago


<!–
–>
Originally published on www.modernghana.com
