

July 29, 2026
Ghana’s Inflation Rollercoaster: How a Cost of Living Crisis Peaked at 54% and What It Cost Ordinary Households


Ghana’s Inflation Rollercoaster: How a Cost of Living Crisis Peaked at 54% and What It Cost Ordinary Households
Keynotes
Inflation swung from a low of 5.8% in December 2018 to a peak of 54.1% in December 2022, in just four years, one of the sharpest cost-of-living reversals in Ghana’s recent history.
Transport costs consistently rose faster than overall prices during every major spike, hitting 71.4% in December 2022, that was 1.32 times the overall inflation rate (54.1%) at that point. Approximately 32% higher than the overall inflation rate.
Overall and transport inflation move together closely (a correlation of 0.83), meaning transport costs are one of the clearest early signals of where general prices are headed.
The 2022 surge was Ghana’s steepest on record in this dataset: overall inflation nearly quadrupled from 13.9% in January 2022 to 54.1% by December, a 40-point jump in twelve months.
Relief has been real but incomplete: by February 2024, overall inflation had eased to 23.2%, still more than four times the 2018 low, even as transport costs cooled sharply to 3.5%.
Why This Matters
Every household in Ghana feels inflation first at the market and the bus stop, and this data shows why 2022 hit so hard: it wasn’t just food and rent climbing, it was the cost of simply getting to work or school. When transport inflation topped 71% at the end of 2022, a trotro fare that many families budgeted for stopped being predictable, and that squeeze fed straight back into the price of everything transported, from tomatoes to building materials.
Workers on fixed salaries, traders who move goods to market, and students commuting daily absorbed this shock hardest, since transport is a cost that can’t easily be cut. Understanding how closely transport and overall inflation move together gives policymakers an early-warning gauge, and gives citizens a reason to watch fuel and fare announcements as a signal of where their cost of living is headed next.
Detailed Analysis
1. A four-year climb down, then a sharper climb back up
Inflation didn’t move in one direction over this period. It fell steadily from 19% in January 2016 to a low of 5.8% by December 2018, then drifted in single digits through most of 2019-2021 (yearly averages of 7.1% and 10.0%). That multi-year calm made the reversal that followed feel especially abrupt.
From January 2022 (13.9%) to December 2022 (54.1%), overall inflation rose nearly fourfold in a single year, the fastest and largest run-up in the dataset, dwarfing any other 12-month stretch on record here.
2. Transport costs consistently amplify the overall trend
Over the study period, transport inflation generally moved in the same direction as overall inflation, but by a wider margin and with larger fluctuations. During the early-2016 spike, transport inflation reached 40.9% while overall inflation remained around 19%. By the December 2022 peak, transport inflation rose to 71.4%, compared with 54.1% for overall inflation, a difference of more than 17 percentage points.
The overall correlation between the two series was 0.83, one of the strongest relationships in the data, indicating that transport inflation was closely associated with movements in overall inflation, although there were some periods when the two moved in different directions.
3. The 2018-2019 low-inflation window shows what stability looks like
Between November 2018 and May 2019, overall inflation held in a narrow 5.8%-6.5% band, with transport inflation similarly steady around 11%-12%. This is the calmest stretch in the entire dataset and stands in sharp contrast to the volatility seen from 2022 onward.
4. Relief since the 2022-23 peak has been real, but not a full return to normal
From the December 2022 peak of 54.1%, overall inflation eased for over a year, reaching 23.2% by February 2024, a meaningful decline, but still more than four times the 2018 low. Transport inflation fell even faster, from 71.4% to 3.5% over the same window, suggesting fuel and transport costs stabilized well ahead of the broader basket of goods.
5. Volatility itself has increased over time
The swings in this dataset are getting wider, not narrower: the gap between the highest and lowest monthly readings before 2022 rarely exceeded 15 percentage points in any single year, while 2022-2023 alone saw overall inflation move across a range of more than 40 points. This pattern of widening swings is one that Gilma’s broader research links to Ghana’s recurring cycle of debt, currency, and price pressures.
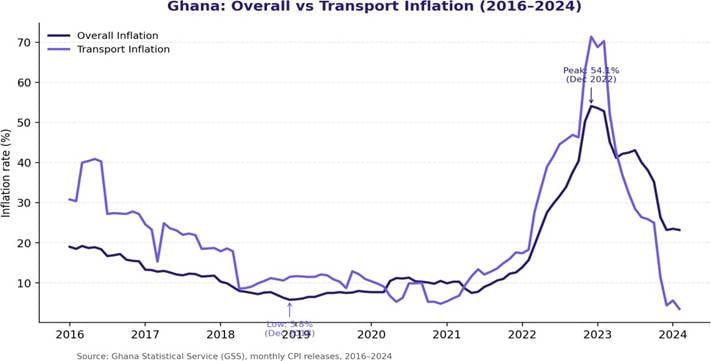 Figure 1: Overall vs. Transport Inflation, Ghana, 2016-2024. Source: Ghana Statistical Service (GSS).
Spotlight: why 2022 and 2023 stand out
The yearly averages below make the scale of the 2022-2023 shock clear. Average inflation jumped from about 10% in 2021 to 31.5% in 2022 and 40.3% in 2023, the two highest years in the entire dataset, before easing to 23.4% in the available 2024 data. This period lines up with a well-documented run of pressures on the Ghanaian economy: a sharp depreciation of the cedi, rising global fuel and food prices tied to the Russia-Ukraine war, and a domestic debt crisis that led Ghana into an IMF-supported program in 2023. Each of these pressures fed into the cost of transport and goods at the same time, which is part of why the spike was so steep and so broad-based.
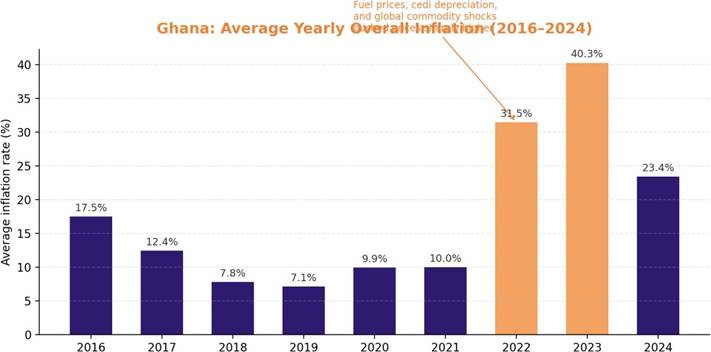 Figure 2: Average yearly overall inflation, Ghana, 2016-2024, with 2022-2023 highlighted as the crisis years. Source: Ghana Statistical Service (GSS).
Recommendations
- Government (Ministry of Finance / Bank of Ghana): Treat transport-cost inflation as a leading indicator in monthly monetary policy reviews, given its 0.83 correlation with overall inflation and its tendency to move first.
- Bank of Ghana: Maintain close monitoring of fuel-price pass-through, since transport costs amplified overall inflation by more than 17 percentage points at the 2022 peak.
- Ministry of Transport / regulators: Review fare-setting mechanisms so transport pricing can respond to fuel cost relief as quickly as it responds to fuel cost increases, given transport inflation’s faster fall to 3.5% by 2024.
- Civil society and consumer-protection bodies: Publish accessible, plain-language inflation trackers for citizens, using transport and food inflation as early warning signals households can act on.
- Researchers and statistical agencies (GSS): Extend this dataset with sub-components (fuel, food, utilities) to clarify which specific costs are driving the association between transport and overall inflation.
Methodology Snapshot
This brief draws on publicly released monthly Consumer Price Index (CPI) inflation data published by the Ghana Statistical Service (GSS), covering January 2016 to February 2024 (98 monthly observations). Two series were compared: headline (overall) inflation and the transport sub-index, using descriptive statistics (means, extremes, yearly averages) and a Pearson correlation coefficient to assess how closely the two series move together. No causal claims are made; the analysis is associational.
Limitations
- The dataset ends in February 2024, so more recent disinflation or renewed price pressures are not captured.
- Only two sub-indices (overall and transport) are included; other major drivers such as food, housing, and utilities are not directly analyzed here.
- Correlation between overall and transport inflation indicates association, not causation; other shared drivers (e.g., currency depreciation, fuel import costs) may explain the co-movement.
- Monthly year-on-year inflation figures can mask short-term volatility within a given month.
- The analysis does not adjust for base effects, which can make year-on-year comparisons look more dramatic during periods following unusually low or high prior-year readings.
Authors: Yussif Mohammed, Andy Sevordzi, Rudolph Djirackor, Franklin Owusu Kwakye
Sources / References
Ghana Statistical Service (GSS). Monthly Consumer Price Index (CPI) inflation releases, January 2016 – February 2024.

Top Stories


Originally published on www.modernghana.com
