

July 20, 2026
7 countries with the highest visa rejection rates for international students
Advertisement
7 countries with the highest visa rejection rates for international students
)
)
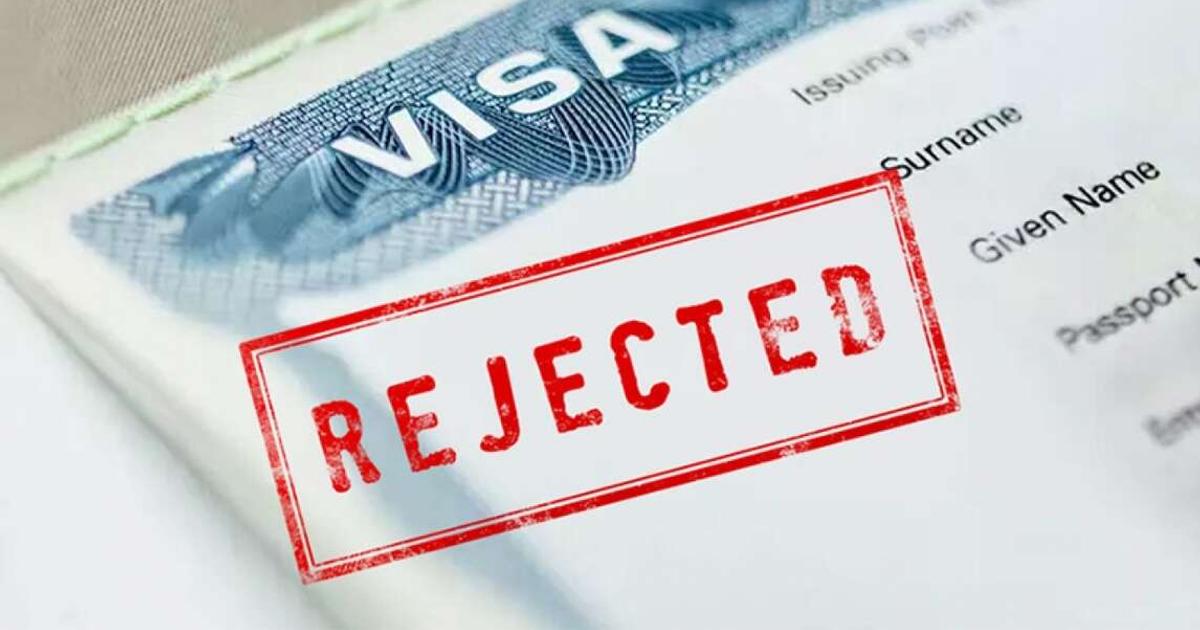
Securing admission to a foreign university is no longer the biggest hurdle for many international students. Increasingly, obtaining a student visa has become the more difficult step, as several of the world’s leading study destinations tighten immigration rules and scrutinise applications more closely.
Advertisement
-
Student visa refusal rates have risen across several of the world’s leading study destinations.
-
Canada recorded the highest rejection rate, with more than half of study permit applications refused.
-
Financial evidence, statements of purpose and proof of temporary intent remain among the leading reasons for visa refusals.
Advertisement
Recent data compiled by GradPilot shows that student visa refusal rates have increased across many popular destinations, reflecting governments’ efforts to manage migration while maintaining the integrity of their international education systems.
)
Canada
Canada recorded the highest rejection rate among the countries analysed, with more than half of study permit applications refused. The sharp rise followed the introduction of new measures, including study permit caps and Provincial Attestation Letter requirements, which significantly tightened the approval process.
Advertisement
Another major North American study destination also recorded its highest student visa refusal rate in a decade. Unlike many countries, its visa system requires applicants to convince a consular officer during an interview that they intend to return home after completing their studies, making the process particularly challenging for some applicants.
US Cuts Visa Processing Centres In Africa To 20
Australia also ranks among the countries with the highest refusal rates. Although its overall rejection rate is lower than Canada’s, changes to visa policies and higher application fees have made securing a study visa more difficult, particularly for students enrolling in English-language programmes.
Advertisement
Several European and Pacific countries also feature on the list, although comparing refusal rates is not always straightforward. While some governments publish detailed visa statistics, others release only limited or irregular data, making direct comparisons more difficult.
Despite differences in immigration systems, the reasons for rejecting student visa applications remain largely the same across countries.
)
UK visa
Immigration authorities commonly refuse applications because of insufficient financial evidence, weak proof that the applicant intends to return home after completing their studies, poorly prepared statements of purpose, incomplete documentation or study plans that do not align with the applicant’s academic or professional background.
Advertisement
Education experts also note that the quality of an application has become increasingly important as visa rules tighten. A well-prepared statement of purpose, supported by clear financial documents and a logical study plan, can significantly improve an applicant’s chances of success.
For prospective international students, understanding visa requirements before applying is just as important as gaining admission to a university. Strong documentation and careful preparation can help reduce the risk of refusal, particularly when applying to countries with historically high rejection rates.
The table below shows the seven (7) countries with the highest student visa rejection rates, based on the latest available data compiled by GradPilot from official immigration sources and government statistics.
7 countries with the highest visa rejection rates
|
Country |
Refusal Rate (Latest) |
Year-over-Year Trend |
Data Reliability |
Official Source |
|---|---|---|---|---|
|
Canada |
~52% (2024) |
Sharply rising (38% in 2023, 65% early 2025, ~45% by Aug 2025) |
High (IRCC publishes granular data) |
IRCC Open Data |
|
USA (F-1) |
41% (FY2024) |
Rising steadily (15% in FY2014, 35% in FY2023) |
High (U.S. State Department publishes by post and nationality) |
U.S. State Department |
|
Australia |
15–18% (2024–25) |
Stable to slight increase; ELICOS sector: 25% |
High (Department of Home Affairs publishes quarterly) |
Department of Home Affairs |
|
France |
8–15% |
Slightly rising (overall visa refusals up 14% in 2024) |
Moderate (Interior Ministry publishes aggregate data) |
French Interior Ministry (via VisaHQ) |
|
Italy |
12–15% |
Data inconsistent across sources |
Low (consulate-level data, not centralized) |
Italian consulate data |
|
Germany |
5–10% |
Stable to slightly improving |
Low (limited public data from embassies) |
German embassy statistics |
|
UK |
4.1% overall (2025) |
Highest since 2016; Q1 2025: 12%, Q2: 9% |
High (Home Office publishes quarterly) |
UK Home Office |
Advertisement
Latest Videos
)
Advertisement
Videos
)
)
)

Advertisement
Advertisement
More from Pulse Ghana
)
)
)
)
)
,fit(112:112))
Advertisement
Originally published on www.pulse.com.gh
